
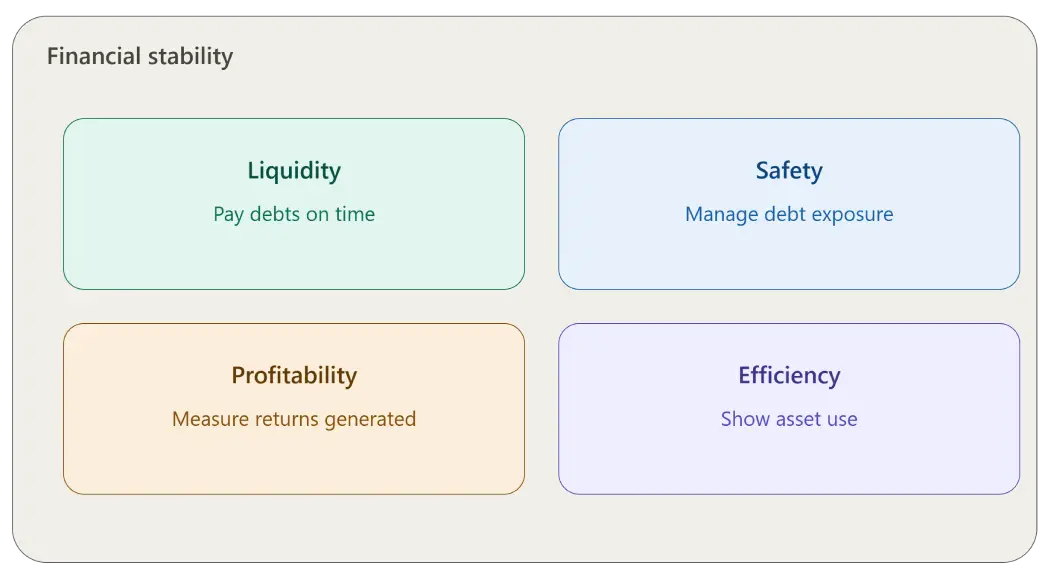
Wondering how to measure financial stability of a company? Start by reviewing four KPI categories: Liquidity, Safety, Profitability, and Efficiency. Together, liquidity and safety ratios show whether a company can meet its short-term and long-term debt obligations, while profitability and efficiency ratios reveal how well it generates returns and manages assets.
How to Measure Financial Stability of a Company
Understanding how to measure financial stability of a company starts with the right KPIs. As discussed in the 1/1/2010 Blog called The 10 Key Financial Reports Every Company Should Use, all companies need to monitor their key performance indicators, or KPIs. There are thousands of KPIs depending on your industry, departmental area, and task.
Management should identify the KPIs that matter most. In addition, they should put policies and procedures in place to maximize results. Comparing your company’s results to the baseline average industry KPIs will allow you to identify your company’s strengths and weaknesses. By monitoring your company’s KPIs over a period of time, management can determine problem areas.
These KPIs, outlined by Harvard Business School as core financial performance measures, are the building blocks of financial stability. Specifically, they fall into four categories, regardless of your industry: Liquidity, Safety, Profitability, and Efficiency.
Liquidity
Liquidity measures whether a company can pay its debts as they become due. The standard 2 ratios used to determine a company’s liquidity are the Quick Ratio and the Current Ratio. These ratios are only as accurate as the underlying data used. For example, uncollectible receivables can inflate Accounts Receivable. When that happens, the ratio overstates the company’s true liquidity.
Quick Ratio uses only assets a company can easily liquidate. Inventory is not included. The general rule is 1:1.
Quick Ratio = (Cash + Accounts Receivable + Other Easily Liquidated Assets) / Current Liabilities
Stable Current Ratio proves whether the company can pay its current liabilities with current assets.
Stable Current Ratio = Total Current Assets / Total Current Liabilities
Safety
Safety measures whether a company carries too much exposure due to debt. Specifically, the standard 3 ratios used to determine a company’s safety are EBIT/Interest, Debt to Equity Ratio, and the Cash Flow to Current Maturity of Long-Term Debt.
EBIT/Interest
EBIT/Interest shows whether the company can meet its interest payments and take on more debt. A higher ratio means the company can more easily meet its interest payments and take on more debt.
EBIT/Interest = Earnings Before Interest & Taxes / Interest Expense
Debt to Equity
A higher Debt to Equity Ratio signals greater risk of default to current and future creditors. However, a ratio that’s too low suggests your company is acting too conservatively.
Debt to Equity = Total Liabilities / Total Equity
Cash Flow to Current Maturity of Long-Term Debt
Cash Flow to Current Maturity indicates whether the company can pay its principal debt payment over the next 12 months.
Cash Flow to Current Maturity of Long-Term Debt = (Net Profit + Non Cash Expenses (i.e. Depreciation, Amortization)) / Current Portion of Long-Term Debt
Profitability
These profitability ratios measure the return on a company’s resources. As a result, positive trends show the company is becoming more profitable. Four standard ratios determine a company’s profitability.
Gross Profit Margin
Gross Profit Margin measures the company’s inventory control, pricing, and production efficiency.
Gross Margin = Gross Profit / Total Sales
Net Profit Margin
Net Profit Margin measures the company’s operating expenses. As a result, it shows whether the company generates enough sales volume to cover minimum fixed costs.
Net Profit Margin = Net Profit / Total Sales
Return on Assets
Return on Assets measures how efficiently the company generates returns on its assets.
Return on Assets = Net Profit Before Taxes / Total Assets
Return on Equity (ROI)
Return on Equity, or Return on Investment, measures a company’s return on invested capital. Use this ratio to compare the investment in the company against other possible investment opportunities. Risk and ROI move together: the greater the risk, the higher the return.
Return on Equity = Net Profit Before Taxes / Net Worth
Efficiency
Efficiency measures how well a company employs its assets. The ratios below are standard efficiency measures. Meanwhile, your specific industry may call for additional KPIs to manage operations effectively.
Accounts Receivable Turnover
Accounts Receivable Turnover measures how fast the company collects its receivables. As a result, a higher turnover means the company collects receivables faster and holds more cash on hand.
Accounts Receivable Turnover = Total Net Sales / Accounts Receivable
Days in Accounts Receivable
Days in Accounts Receivable shows how many days it takes the company to collect all accounts receivable. Fewer days is better, since it means the company is collecting faster on its accounts.
Days in Accounts Receivable = 365 days / Accounts Receivable Turnover
Accounts Payable Turnover
Accounts Payable Turnover measures how fast the company pays its creditors. However, a higher number can mean two things: either the company manages its creditors well and holds onto cash longer, or it struggles to pay creditors due to liquidity issues. Understanding which reason applies is critical to spotting a real problem.
Accounts Payable Turnover = Cost of Goods Sold / Accounts Payable
Days in Accounts Payable
Days in Accounts Payable shows how many days it takes the company to pay all accounts payable. Meanwhile, make sure your company takes advantage of vendor discounts.
Days in Accounts Payable = 365 days / Accounts Payable Turnover
Inventory Turnover
Inventory Turnover shows how many times a company sells its inventory in one accounting period. It’s an important measure for spotting obsolete or mismanaged stock. Consequently, a faster turnover trend improves cash flow and strengthens inventory controls.
Inventory Turnover = Cost of Goods Sold / Inventory
Days in Inventory
Days in Inventory shows the average number of days it takes to turn over a company’s inventory.
Days in Inventory = 365 days / Inventory Turnover
Sales to Total Assets
Sales to Total Assets measures how efficiently the company generates sales on each dollar of assets.
Sales to Total Assets = Total Sales / Total Assets
Debt Coverage Ratio
Debt Coverage Ratio shows a company’s ability to satisfy its debt obligations and take on additional debt.
Debt Coverage = (Net Profit + Any Non-Cash Expenses) / Principal on Debt
Now that you know how to measure financial stability of a company, put these ratios to work. Contact Consult Your CFO for a free analysis of where your business stands.
Frequently Asked Questions
What are the four categories used to measure financial stability?
Financial stability is typically measured across four KPI categories: liquidity (whether a company can meet its short-term obligations), safety (debt exposure and long-term solvency), profitability (returns generated on the company’s resources), and efficiency (how well assets are being deployed to generate revenue). Tracking ratios in each category — and comparing them to industry benchmarks — gives a fuller picture of financial health than any single metric on its own.
What is a good current ratio for financial stability?
The current ratio (total current assets divided by total current liabilities) measures whether a company can cover its short-term liabilities with its short-term assets. As a general rule of thumb, a current ratio between 1.5 and 3 is considered healthy, with 2:1 often cited as a solid target. A ratio below 1 can signal a liquidity problem, while a very high ratio (well above 3) may mean the company is sitting on excess assets — such as unsold inventory or uncollected receivables — instead of putting them to productive use. What counts as “good” varies by industry, so current ratio should always be benchmarked against comparable companies.
What is the difference between the current ratio and the quick ratio?
Both ratios measure short-term liquidity, but the quick ratio (also called the “acid-test” ratio) is more conservative: it excludes inventory and other assets that aren’t easily converted to cash, counting only cash, marketable securities, and receivables against current liabilities. The general rule for a healthy quick ratio is 1:1. Comparing the two ratios shows how dependent a company’s liquidity is on selling inventory.
Why does liquidity matter when measuring a company’s financial stability?
Liquidity measures a company’s ability to pay short-term debts as they come due. A profitable business can still fail if it doesn’t have enough liquid assets to cover near-term obligations, which is why liquidity ratios like the current ratio and quick ratio are one of the first places CFOs look when assessing financial stability.
What ratios fall under the “safety” category?
Safety ratios evaluate a company’s debt exposure and long-term solvency. Common examples include the EBIT-to-interest ratio (a measure of how comfortably a company can cover its interest payments), the debt-to-equity ratio (how much of the company is financed by debt versus owner equity), and cash flow to current maturity of long-term debt (whether operating cash flow can cover debt coming due).
How is profitability measured as part of financial stability?
Profitability metrics show how effectively a company converts revenue and resources into returns. The most common measures are gross profit margin, net profit margin, return on assets, and return on equity (ROI). Tracking these over time, and against industry averages, helps identify whether a company’s growth is actually translating into sustainable earnings.
Why compare financial ratios to industry benchmarks?
A ratio on its own has limited meaning — a current ratio of 1.2 might be perfectly healthy in one industry and a warning sign in another. Comparing a company’s liquidity, safety, profitability, and efficiency ratios to baseline average industry KPIs shows whether performance is actually strong relative to peers, rather than just strong in isolation.